I’ve always been “in tune” with nature, water and the rhythm of the ocean, beats, and dancing. When brainstorming ideas for my "Diagram of the Self" I began to think about it all; music, emotions, rhythm, vibrations, waves, color; and the things they have in common. My brain began to "flood" trying to get a grasp on the connections; sound travels in waves, light travels in waves, color evokes emotion, music evokes emotions, dancing makes me feel free, beats, amplitude, wavelength, how the brain perceives color, how we interpret color, what contributes to the way we experience it all? Whoa...it was like the 500 television screens in my head were all on a different channel, but the channels were from the same broadcasting network.
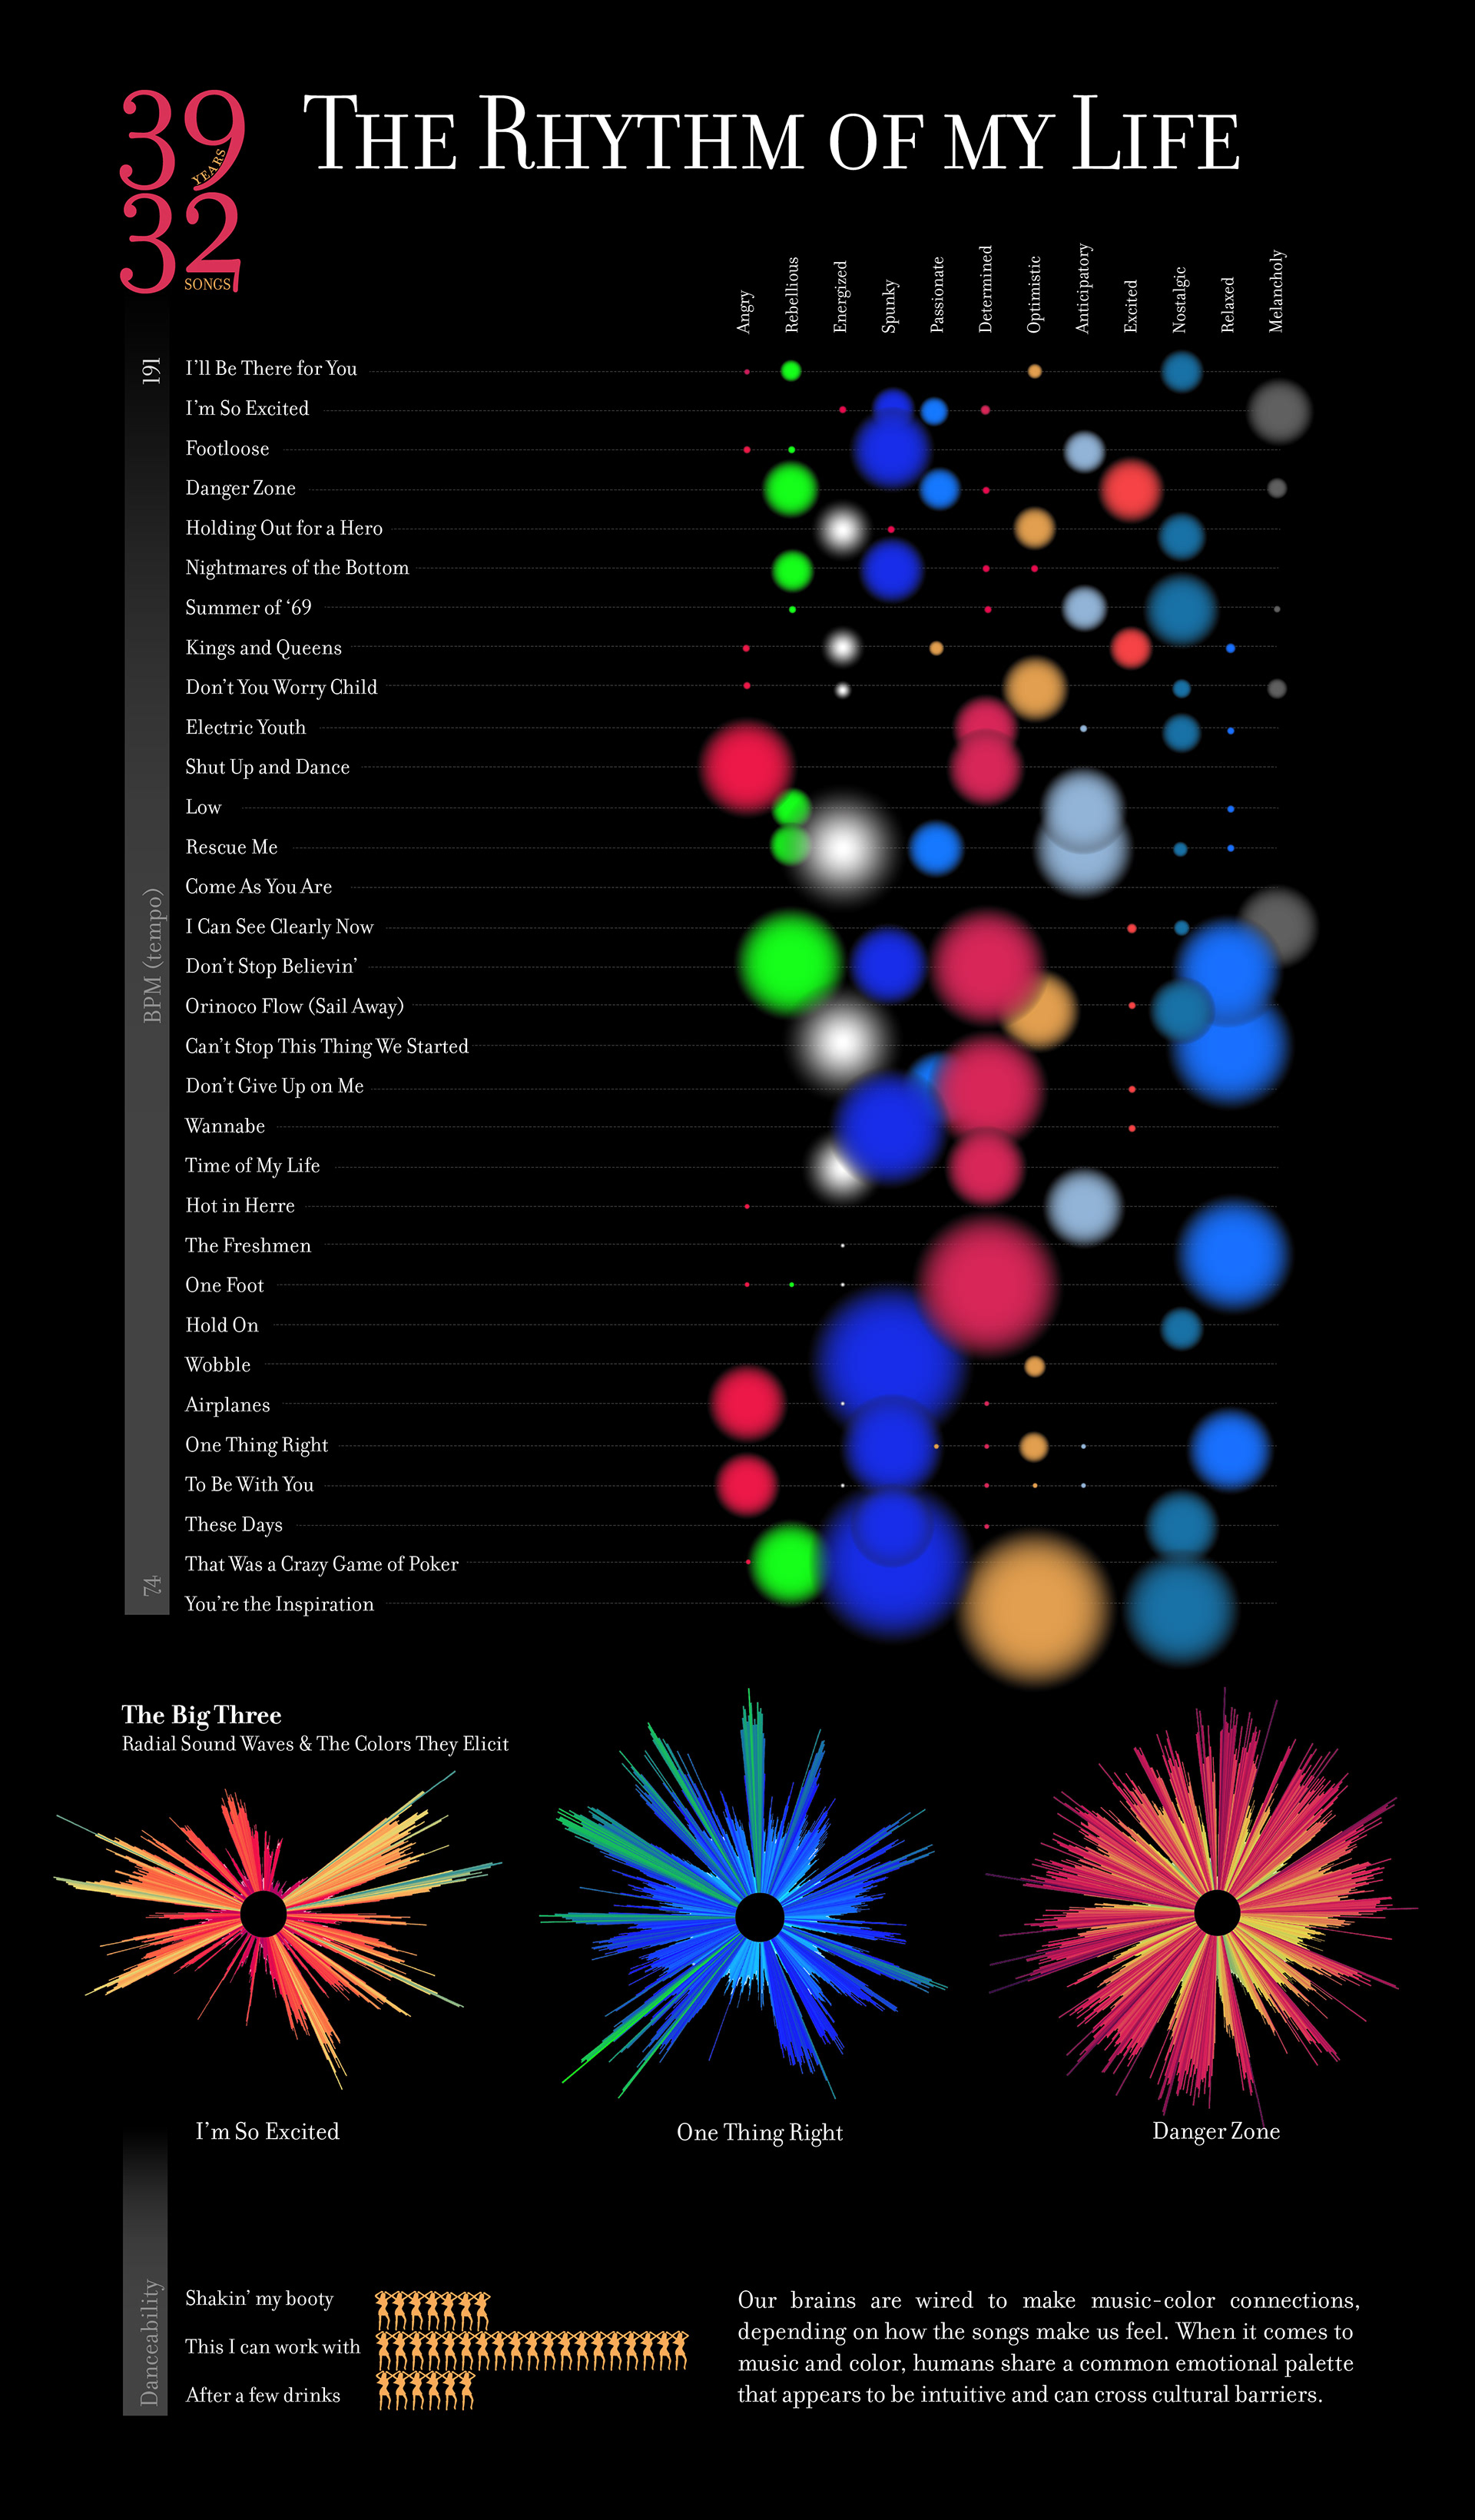
Trying to find connections, I did in depth research on the the wavelength to color relationship, what types of data can be extracted from music, sound waves, acoustics for music theory, spectrograms, and the relationships between music, color, and emotion. Although I learned quite a bit, I was still having trouble grasping the totality of the connections or what I was aiming to do. I decided to just put my "Songs of my life" playlist on repeat, sat down at my computer, and went to town exploring and creating. The data visualization below is the result of eight hours of research, two hours of exploring data visualization, nine hours in Illustrator (I took a few breaks), and I don't even know how many times of listening through my playlist. You can learn more about my process, the songs, and see the data here.
Trying to find connections, I did in depth research on the the wavelength to color relationship, what types of data can be extracted from music, sound waves, acoustics for music theory, spectrograms, and the relationships between music, color, and emotion. Although I learned quite a bit, I was still having trouble grasping the totality of the connections or what I was aiming to do. I decided to just put my "Songs of my life" playlist on repeat, sat down at my computer, and went to town exploring and creating. The data visualization below is the result of eight hours of research, two hours of exploring data visualization, nine hours in Illustrator (I took a few breaks), and I don't even know how many times of listening through my playlist. You can learn more about my process, the songs, and see the data here.
Want to see the PDF?